

Description
What our Line Plots and Fractions lesson plan includes
Lesson Objectives and Overview: Line Plots and Fractions teaches students how to plot fractions on line plots. At the end of the lesson, students will be able to make a line plot to display data in fractions of a unit and analyze the data on the line plot. This lesson is for students in 5th grade.
Classroom Procedure
What Every lesson plan provides you with a classroom procedure page that outlines a step-by-step guide to follow. You do not have to follow the guide exactly. The guide helps you organize the lesson and details when to hand out worksheets. It also lists information in the blue box that you might find useful. You will find the lesson objectives, state standards, and number of class sessions the lesson should take to complete in this area. In addition, it describes the supplies you will need as well as what and how you need to prepare beforehand. The supplies you will need for this lesson include ribbon, scissors, and rulers.
Options for Lesson
Included with this lesson is an “Options for Lesson” section that lists a number of suggestions for activities to add to the lesson or substitutions for the ones already in the lesson. One optional addition to this lesson is to have your students use data they collect from an activity day such as jumping distances or measuring their reflexes using a ruler to plot data using fractions. To extend this lesson, you could incorporate itwith other cross curricular lessons for engaging students.
Teacher Notes
The teacher notes page includes a paragraph with additional guidelines and things to think about as you begin to plan your lesson. This page also includes lines that you can use to add your own notes as you’re preparing for this lesson.
LINE PLOTS AND FRACTIONS LESSON PLAN CONTENT PAGES
Line Plots and Fractions
The Line Plots and Fractions lesson plan includes one content page. Line plots are a graphical way to display data. With line plots, we can look at large amounts of data and easily see patterns. Line plots are straight lines broken into equal intervals. The lesson shows an example line plot broken up into 1/8 intervals.
On this line plot, each piece of data is represented by an X above its corresponding value. For this line plot, the values of the data are 1, 1, 1, 11/8,11/8, 1 2/8, 1 4/8,1 7/8, 2, 2, 2, and 2 1/8. The bottom of the line plot tells us that the unit of measurement for this data is cups. However, the line plot is missing a key piece of data—a title! It’s always important to include a title so that the person reading the graph understands what it’s showing.
We could give this graph the title “Sugar in Cookies.” Maybe a group of chefs wanted to compare the amount of sugar in different recipes. When they look at the graph, they can see that the difference in sugar from the most to the least was 2 1/8 – 1 = 1 1/8. They can also see that most recipes used either 1 or 2 cups of sugar. And if they added up all the sugar in all of the different recipes, they would find that there’s a total of 18 cups of sugar in all of the recipes.
Line plots are an easy way to understand large amounts of data!
LINE PLOTS AND FRACTIONS LESSON PLAN WORKSHEETS
The Line Plots and Fractions lesson plan includes three worksheets: an activity worksheet, a practice worksheet, and a homework assignment. You can refer to the guide on the classroom procedure page to determine when to hand out each worksheet.
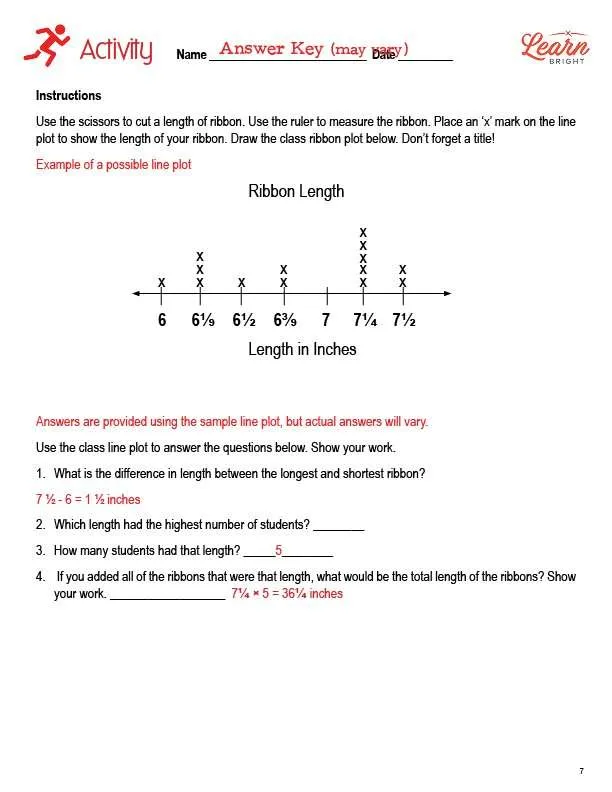
RIBBON ACTIVITY WORKSHEET
For the activity worksheet, students will use scissors to cut a length of ribbon. They will then use a ruler to measure their ribbon, placing an X on the class line plot to show the length of their ribbon. Once every student has added their X to the class line plot, they will answer questions about the data.
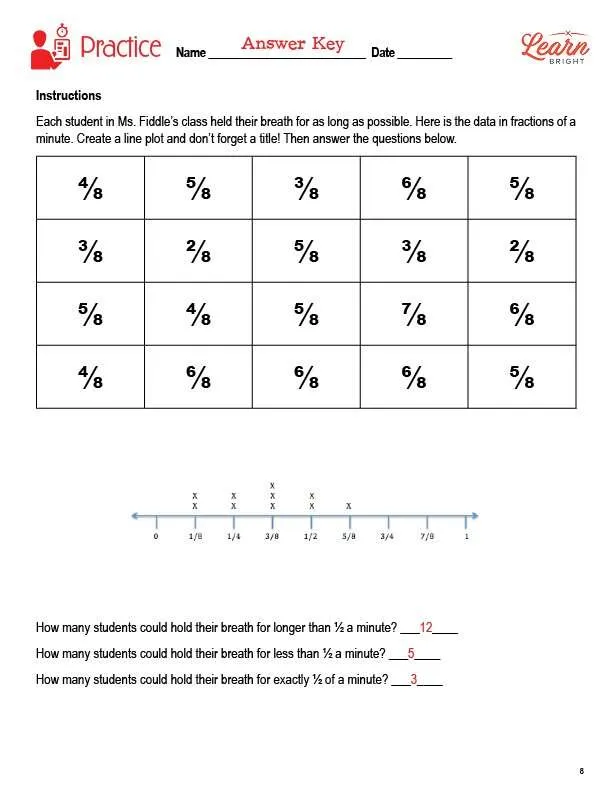
CREATING A LINE PLOT PRACTICE WORKSHEET
The practice worksheet asks students to create a line plot using the data shown on the worksheet. They will then answer a few questions about the line plot.
LINE PLOTS AND FRACTIONS HOMEWORK ASSIGNMENT
For the homework assignment, students will use the line plot shown on the worksheet to write a story. They will also give their graph a unique title.
Worksheet Answer Keys
This lesson plan includes answer keys for the activity worksheet, the practice worksheet, and the homework assignment. If you choose to administer the lesson pages to your students via PDF, you will need to save a new file that omits these pages. Otherwise, you can simply print out the applicable pages and keep these as reference for yourself when grading assignments.