


Description
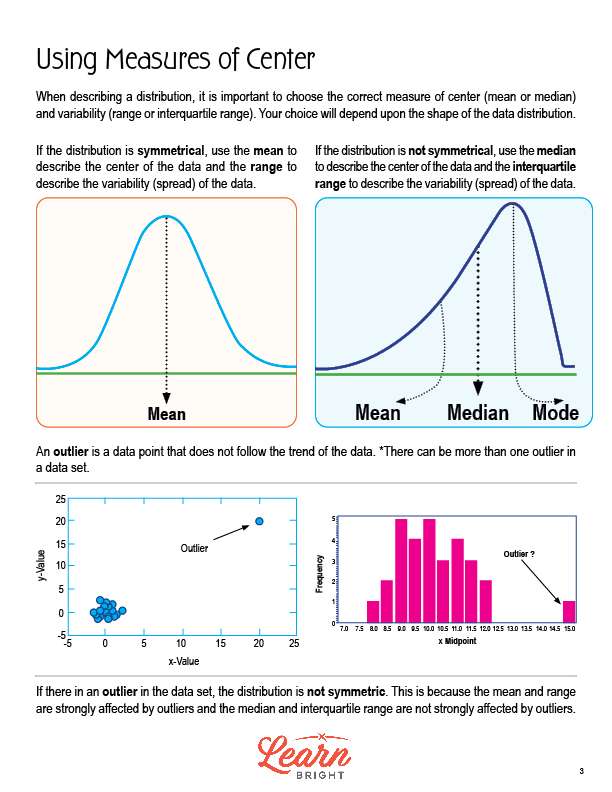
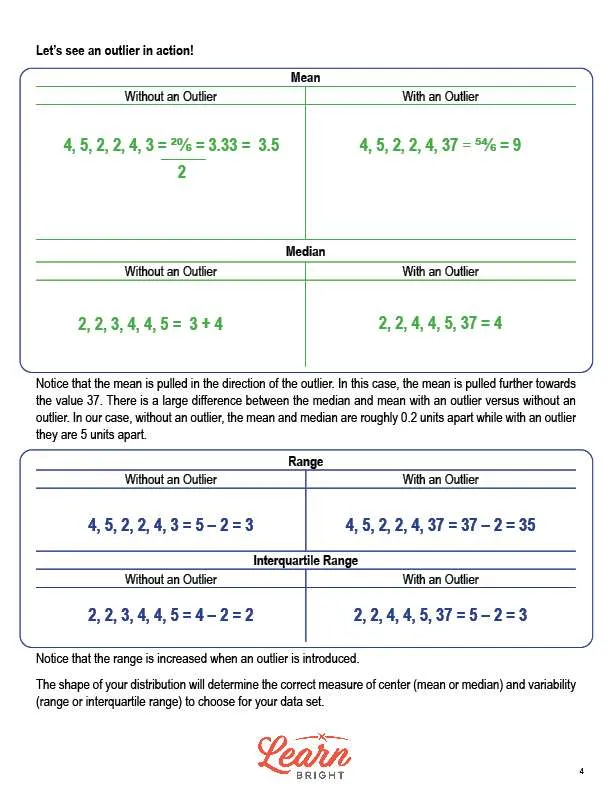
Our Using Measures of Center lesson plan teaches students about measures of center and variability and how they are related to the shape of a data distribution. During this lesson, students are asked to work collaboratively with a group to measure the weight of each person’s lunch to the nearest pound and then find the mean, median, mode, and range of their data set. Students are also asked to look at graphs and other representations of data and choose the appropriate measures to describe the center and spread of the distribution; they then justify their response based on the shape of the distribution.
At the end of the lesson, students will be able to relate the choice of measures of center and variability to the shape of the data distribution.