

Description
What our Summarizing Numerical Data Sets lesson plan includes
Lesson Objectives and Overview: Summarizing Numerical Data Sets teaches students how to read data sets and determine the number of observations found in them. At the end of the lesson, students will be able to report the number of observations in data sets. This lesson is for students in 6th grade.
Classroom Procedure
Every lesson plan provides you with a classroom procedure page that outlines a step-by-step guide to follow. You do not have to follow the guide exactly. The guide helps you organize the lesson and details when to hand out worksheets. It also lists information in the blue box that you might find useful. You will find the lesson objectives, state standards, and number of class sessions the lesson should take to complete in this area. In addition, it describes the supplies you will need as well as what and how you need to prepare beforehand.
Options for Lesson
Included with this lesson is an “Options for Lesson” section that lists a number of suggestions for activities to add to the lesson or substitutions for the ones already in the lesson. To expand this lesson, you can integrate it with other lessons focused on how to read or draw graphs. To enhance your students’ understanding of the lesson material, you could emphasize that different graphs may have a key that includes a dot that represents more than one observation. An optional addition to the lesson is to discuss the difference and similarities between an observation in math and an observation in science. Finally, you can cut some of the lesson graphs apart and use them in a smaller version.
Teacher Notes
The teacher notes page includes a paragraph with additional guidelines and things to think about as you begin to plan your lesson. This page also includes lines that you can use to add your own notes as you’re preparing for this lesson.
SUMMARIZING NUMERICAL DATA SETS LESSON PLAN CONTENT PAGES
Summarizing Numerical Data Sets/Observations
The Summarizing Numerical Data Sets lesson plan includes two content pages. The total number of items or people counted or represented in a graph is the number of observations in a data set. We abbreviate the number of observations in a data set as the lowercase letter n. For 3 observations, we write n = 3.
Knowing the the number of observations in a data set is important because it can influence the significance of the results. The number of observations is used in many other formulas throughout statistics.
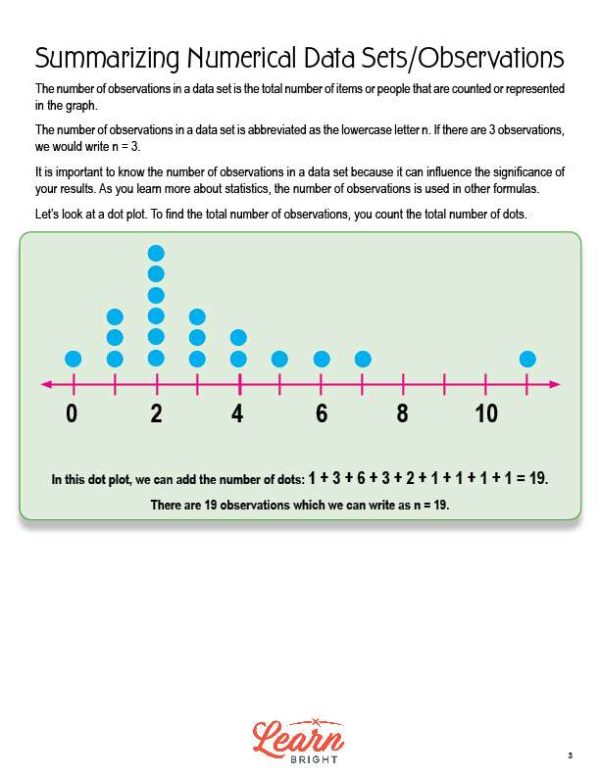
Let’s look at an example. The worksheet shows a dot plot. Count the total number of dots to find the total number of observations. In the example dot plot, we add the number of dots: 1 + 3 + 6 + 3 + 2 + 1 + 1 + 1 + 1 = 19. This means that the dot plot has 19 observations, or n = 19.
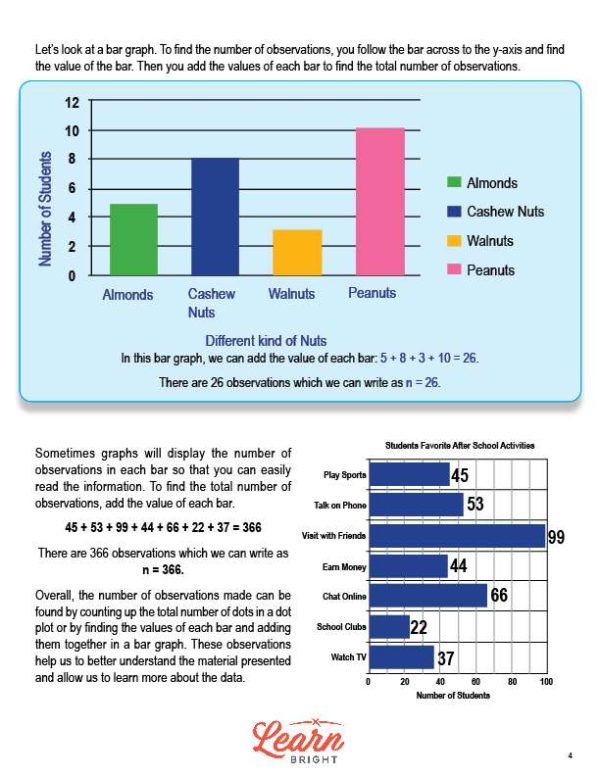
Let’s look at another example. The worksheet shows a bar graph. For bar graphs, follow the bar across to the y-axis to find the value of each bar and add the values of each bar together to find the total number of observations. For the example bar graph, we add the value of each bar: 5 + 8 + 3 + 10 = 26. The bar graph has 26 observations, or n = 26.
Some graphs display the number of observations next to each bar to make the information easier to read. To find the total number of observations, simply add the value of each bar. The lesson shows an example of this kind of graph.
To summarize, we can find the number of observations made can be found by adding the total number of dots in a dot plot or by finding the values of each bar and adding them together in a bar graph. Knowing how to find these observations helps us understand the material and learn more about the data.
SUMMARIZING NUMERICAL DATA SETS LESSON PLAN WORKSHEETS
The Summarizing Numerical Data Sets lesson plan includes three worksheets: an activity worksheet, a practice worksheet, and a homework assignment. You can refer to the guide on the classroom procedure page to determine when to hand out each worksheet.
LOCATING GRAPHS ACTIVITY WORKSHEET
For the activity worksheet, students will locate the nine graphs hidden around the classroom and write down the total number of observations in each.
HOW MANY OBSERVATIONS PRACTICE WORKSHEET
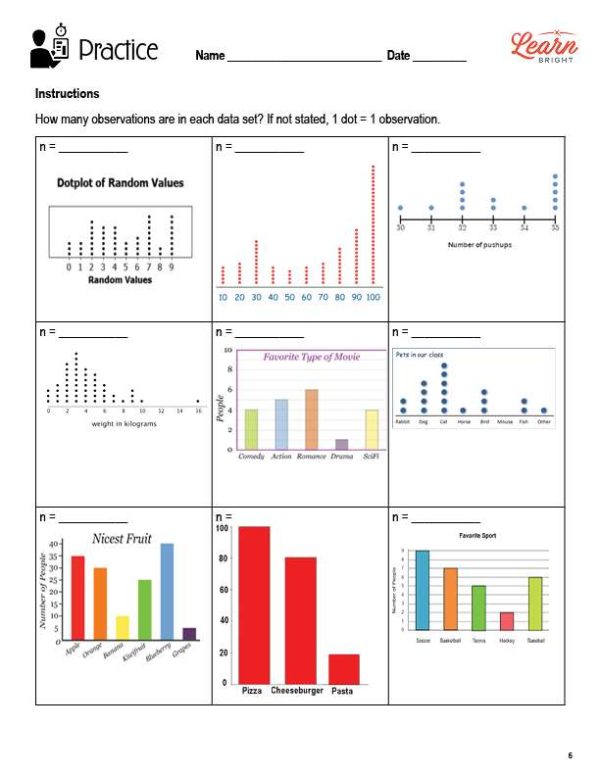
The practice worksheet asks students to determine how many observations are in each data set shown on the worksheet.
SUMMARIZING NUMERICAL DATA SETS HOMEWORK ASSIGNMENT
For the homework assignment, students will use the internet to find three dot plots and three bar graphs. They will then find the number of observations in each data set, writing their answers as n = ____.
Worksheet Answer Keys
This lesson plan includes answer keys for the activity worksheet, the practice worksheet, and the homework assignment. If you choose to administer the lesson pages to your students via PDF, you will need to save a new file that omits these pages. Otherwise, you can simply print out the applicable pages and keep these as reference for yourself when grading assignments.