

Description
What our Statistical Variability lesson plan includes
Lesson Objectives and Overview: Statistical Variability goes over vocabulary and concepts such as variability, range, interquartile range, and outliers. It also spends time on how to interpret this data from various types of graphs. At the end of the lesson, students will be able to recognize the difference between measures of center and variability. The students will also be able to calculate the measure of variability and compare side by side graphs. This lesson is for students in 6th grade.
Classroom Procedure
Every lesson plan provides you with a classroom procedure page that outlines a step-by-step guide to follow. You do not have to follow the guide exactly. The guide helps you organize the lesson and details when to hand out worksheets. It also lists information in the blue box that you might find useful. You will find the lesson objectives, state standards, and number of class sessions the lesson should take to complete in this area. In addition, it describes the supplies you will need as well as what and how you need to prepare beforehand.
Options for Lesson
Included with this lesson is an “Options for Lesson” section that lists a number of suggestions for activities to add to the lesson or substitutions for the ones already in the lesson. If you have more advanced students, you can increase the difficulty of the lesson by incorporating more calculation of outliers or of constructing graphs or sets of data that demonstrate different degrees of variability. For these advanced learners, you can also teach them to calculate the variance and standard deviation of sets of data using this lesson as a springboard.
Teacher Notes
The teacher notes page includes lines that you can use to add your own notes as you’re preparing for this lesson.
STATISTICAL VARIABILITY LESSON PLAN CONTENT PAGES
Variability
The Statistical Variability lesson plan includes three content pages. Mathematicians use the term variability when discussing sets of data in statistics. Variability describes how spread out the data is from the mean (the measure of center). The more spread out from the mean, the bigger the variance in that set of data.
Range
The range shows how spread out the data is based on a set of given data points or graphical displays. When using data points, you must first put the data in order. Next, find the difference between the greatest value and the least value.
Let’s take a look at an example. The local zoo wants to make sure that their baby pythons are growing correctly, so they measure the length of each snake when it hatches. The lesson lists their measurements in inches. The data points are 14, 10, 12, 14, 11, 12, 12, 11, 13, and 15.
First, order the data: 10, 11, 11, 12, 12, 12, 13, 14, 14, 15. Next, locate the greatest and least values: 10 and 15. Then, find the difference: 15 – 10 = 5. The range is 5.
When looking at a graphical display of data, you can find the greatest and least values by looking at the x-axis. The lesson includes an example graph for practice.
Interquartile Range
Quartiles divide a data set into four equal groups (quartiles). Think of how you can break a dollar into four equal amounts called quarters.
To find the interquartile range (IQR), you must first put the data in order. Next, find the median. Finally, find each quartile for the lower and upper portions of the data.
Let’s take a look at an example, using the baby python data from earlier in the lesson. First, put the data in order: 10, 11, 11, 12, 12, 12, 13, 14, 14, 15. Next, find the median. Because this data set has an even number of pieces of data, we need to take the average of the middle two data points (12 and 12) for a median of 12. Finally, find the median of the lower and upper halves. The lower quartile, also known as Q1, is 11. The upper quartile, also known as Q3, is 14. The range within those quartiles (Q3 – Q1) is 14 – 11 = 3. Therefore, the IQR is 3.
Outliers
When a data set includes values that lie outside of the main values in a data set, we call them outliers. Identifying outliers is important because they can skew measures of center. Graphs often mark any outliers with an asterisk (*). Scientists and mathematicians often “throw out” (not use) any outliers because of how they affect the data.
You can check if a piece of data is an outlier using the following calculations: Q1 – 1.5(IQR) = values less than that are an outlier; Q3 + 1.5 IQR = values greater are an outlier.
Let’s test this using the baby python data from earlier in the lesson. What if a baby python was 6 inches when it hatched? Would it be an outlier? Let’s test it using our calculation. For this data set, we know that Q1 = 11 and the IQR is 3. We need to plug those values into our calculation: Q1 – 1.5(IQR) = 11 – 1.5(3) = 11 – 4.5 = 6.5. Any value less than 6.5 would be an outlier, so a 6 inch baby python would be an outlier!
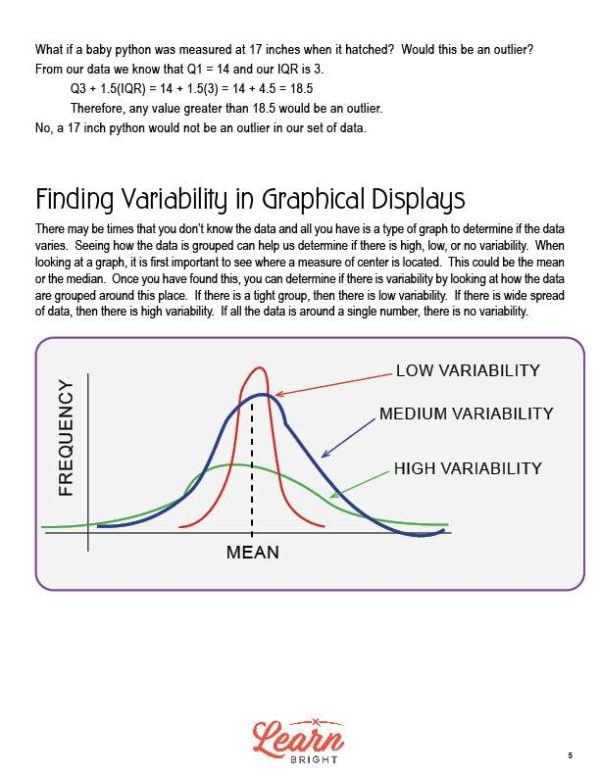
What if a baby python was 17 inches when it hatched? Would it be an outlier? Let’s test it using our calculation. For this data set, we know that Q3 = 14 and the IQR is 3. We need to plug those values into our calculation: Q3 + 1.5(IQR) = 14 + 1.5(3) = 14 + 4.5 = 18.5. Any value greater than 18.5 would be an outlier, so a 17 inch python would not be an outlier.
Finding Variability in Graphical Displays
Sometimes, you won’t have the individual data points for a data set. Instead, you need to determine if the data varies based only on the type of graph. Looking at how the data is grouped can help us determine if there is high, low, or no variability.
When looking at a graph, first look at where the measure of center (the mean or median) is located. Finding this will help you determine if there is variability by looking at how the data is grouped around that point. If you see a tight group of data, there is low variability. If you see a wide spread of data, there is high variability. If all the data is around a single number, there is no variability!
STATISTICAL VARIABLITY LESSON PLAN WORKSHEETS
The Statistical Variability lesson plan includes four worksheets: an activity worksheet, a practice worksheet, a homework assignment, and a quiz. You can refer to the guide on the classroom procedure page to determine when to hand out each worksheet.
SCULPTING ACTIVITY WORKSHEET
For the activity worksheet, students will sculpt an object using the clay provided. Their object can be as big or small as they like. Once they’re finished, they will weigh their sculpture on the scale and record their data on the class chart. Finally, they will copy the class data into the chart on the worksheet and answer the questions.
BOX AND WHISKERS PRACTICE WORKSHEET
The practice worksheet first asks students to calculate the range and IQR of the box and whisker plot shown on the worksheet. They will also determine if it has high, low, or no variability. They will also answer questions about other box and whiskers plots shown on the worksheet.
STATISTICAL VARIABILITY HOMEWORK ASSIGNMENT
For the homework assignment, students will find the range, IQR, and variability for the graph shown. They will also answer some additional questions about the graph and label each data display to describe its level of variability as high, low, or none.
QUIZ
This lesson also includes a quiz that you can use to test students’ understanding of the lesson material. For the quiz, students will answer statistical variability questions using the graph shown on the worksheet.
Worksheet Answer Keys
This lesson plan includes answer keys for the practice worksheet, the homework assignment, and the quiz. If you choose to administer the lesson pages to your students via PDF, you will need to save a new file that omits these pages. Otherwise, you can simply print out the applicable pages and keep these as reference for yourself when grading assignments.