

Description
What our Statistical Distributions lesson plan includes
Lesson Objectives and Overview: Statistical Distributions teaches students the basics of statistical distribution, including what it is and how it’s used. This lesson begins by describing a statistical distribution, and providing examples of questions that are and are not statistical questions. Examples of several types of graph shapes are included. At the end of the lesson, students will be able to identify and write statistical questions. The student will be able to understand that a set of data collected using a statistical question has a distribution that is described by its center, shape, and spread. This lesson is for students in 6th grade.
Classroom Procedure
Every lesson plan provides you with a classroom procedure page that outlines a step-by-step guide to follow. You do not have to follow the guide exactly. The guide helps you organize the lesson and details when to hand out worksheets. It also lists information in the blue box that you might find useful. You will find the lesson objectives, state standards, and number of class sessions the lesson should take to complete in this area. In addition, it describes the supplies you will need as well as what and how you need to prepare beforehand.
Options for Lesson
Included with this lesson is an “Options for Lesson” section that lists a number of suggestions for activities to add to the lesson or substitutions for the ones already in the lesson. One optional addition to this lesson is to have your students write statistical questions as a class and answer them. You can also show your students how to use the computer to create a graph. Finally, you could review measures of central tendency.
Teacher Notes
The teacher notes page includes lines that you can use to add your own notes as you’re preparing for this lesson.
STATISTICAL DISTRIBUTIONS LESSON PLAN CONTENT PAGES
Statistical Questions
The Statistical Distributions lesson plan includes three content pages. You can answer a statistical question using data that may vary or change. If you can answer a question with a single number or answer, it’s not a statistical question.
For example, “How tall are you?” is not a statistical question, but “How many minutes do 6th grade students spend on homework each week?” is.
You answer statistical questions by collecting data, which will vary from person to person. Statistical questions look at large groups or populations.
Other examples of statistical question are “How old are the typical residents at a nursing home?” and “What is a 6th graders favorite food?”. Questions like “How old are you?” and “How many minutes did you read last night?” are not!
Graphical Displays: Center
Graphical displays of data make it much easier to see patterns in the data. Mathematicians look for three main patterns in data: center, spread, and shape.
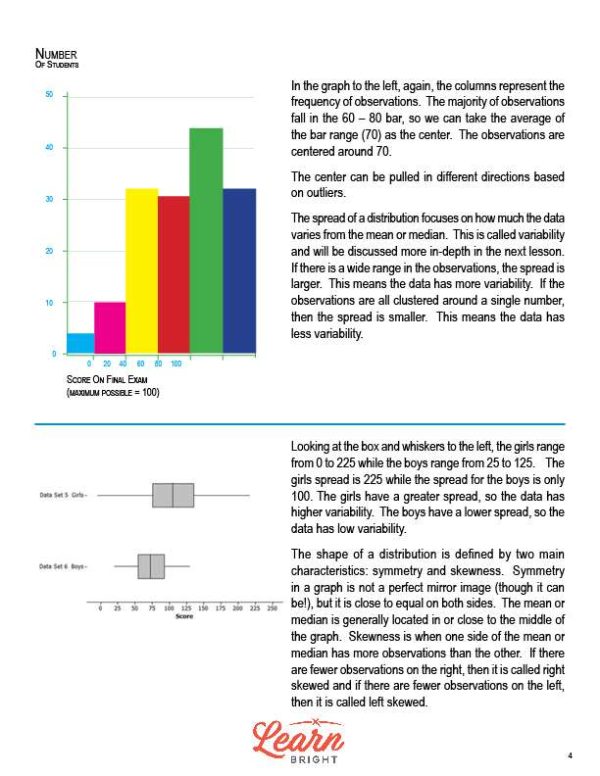
The center of a distribution is either the median or the mean. In other words, it’s the point where roughly half of the observations are on one side and half are on the other side. The lesson includes a few helpful example graphs and shows how to find the center of each. Outliers can pull the center of a graph in different directions.
Graphical Displays: Spread
The spread of a distribution tells you how much the data varies from the mean or median (also called its variability). A wide range in the observations means the spread is larger and the data has more variability. Observations clustered around a single number means that the spread is smaller and the data has less variability.
The lesson includes an example box and whiskers graph. In this graph, girls range from 0 to 225 while the boys range from 25 to 125. The girls spread is 225 while the spread for the boys is only 100. The girls have a greater spread, so the data has higher variability. The boys have a lower spread, so the data has low variability.
Graphical Displays: Shape
The shape of a distribution depends on two main characteristics: symmetry and skewness. Symmetry in a graph does not necessarily mean it is a perfect mirror image (though it can be!), but that it is close to equal on both sides. A graph’s mean or median is generally located in or close to its middle.
Skewness is when one side of the mean or median has more observations than the other. It’s right skewed if there are fewer observations on the right and left skewed if there are fewer observations on the left.
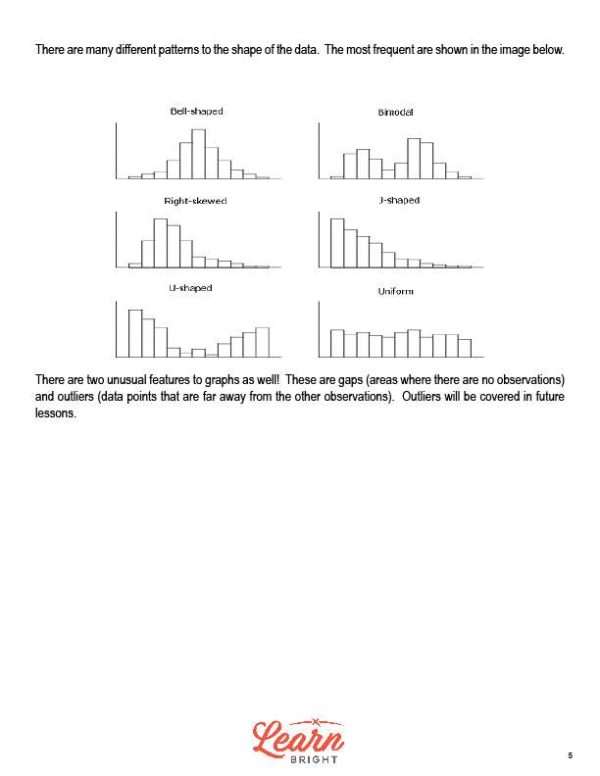
While there are many different patterns to the shape of data, the lesson shows the most frequent: bell-shaped, bimodal, right-skewed, J-shaped, U-shaped, and uniform.
Some graphs also have one of two unusual features—gaps (areas where there are no observations) and outliers (data points that are far away from the other observations).
STATISTICAL DISTRIBUTIONS LESSON PLAN WORKSHEETS
The Statistical Distributions lesson plan includes four worksheets: an activity worksheet, a practice worksheet, a homework assignment, and a quiz. You can refer to the guide on the classroom procedure page to determine when to hand out each worksheet.
STACKING CUPS ACTIVITY WORKSHEET
Students will work in groups to complete the lesson activity. Each student will take turns stacking groups of cups (10 cups, 15 cups, and 21 cups) in pyramids while another student times them. They will record their times in the chart on the worksheet. They will then collect the times of the other students in the class to create a bar graph, line plot, and another graph of their choice. Finally, they will describe the center, shape, and spread of each graph.
STATISTICAL OR NOT PRACTICE WORKSHEET
For the practice worksheet, students will first determine if five questions are statistical or not. They will also describe four different graphical displays of data.
STATISTICAL DISTRIBUTIONS HOMEWORK ASSIGNMENT
The homework assignment asks students to research a topic of their choice and write a statistical question. They will collect 20 data points (either by asking people or using data from a website). After they’ve collected the data, they will create a graph. Finally, they will describe the center, shape, and spread of the data.
QUIZ
This lesson also includes a quiz that you can use to test students’ understanding of the lesson material. For the quiz, students will first determine if the question on the worksheet is a statistical question or not. Next, they will describe a few graphical displays.
Worksheet Answer Keys
This lesson plan includes answer keys for the practice worksheet and the quiz. If you choose to administer the lesson pages to your students via PDF, you will need to save a new file that omits these pages. Otherwise, you can simply print out the applicable pages and keep these as reference for yourself when grading assignments.