

Description
What our Represent and Interpret Data lesson plan includes
Lesson Objectives and Overview: Represent and Interpret Data teaches students how to use and create line plots and fractional number lines. At the end of the lesson, students will be able to represent and interpret data on a line plot using fractional number lines. This lesson is for students in 4th grade, 5th grade, and 6th grade.
Classroom Procedure
Every lesson plan provides you with a classroom procedure page that outlines a step-by-step guide to follow. You do not have to follow the guide exactly. The guide helps you organize the lesson and details when to hand out worksheets. It also lists information in the blue box that you might find useful. You will find the lesson objectives, state standards, and number of class sessions the lesson should take to complete in this area. In addition, it describes the supplies you will need as well as what and how you need to prepare beforehand. The supplies you will need for this lesson include dice, spinners, colored paper, large pieces of paper, cardboard, and other supplies for creating game boards.
Options for Lesson
Included with this lesson is an “Options for Lesson” section that lists a number of suggestions for activities to add to the lesson or substitutions for the ones already in the lesson. One optional addition to this lesson is to have your students use bags of coins (interpreting the value of the coin as a fraction) to create a line plot about spare change. You could also have your students measure cups of water to collect fractional data to interpret. Finally, an optional addition to the lesson activity is to bring in old board games and allow students to use them to create their own.
Teacher Notes
The teacher notes page includes lines that you can use to add your own notes as you’re preparing for this lesson.
REPRESENT AND INTERPRET DATA LESSON PLAN CONTENT PAGES
Line Plots with Fractions
The Represent and Interpret Data lesson plan includes two content pages. When collecting and interpreting data, the method of data collection is very important. The way that a question is asked and who is asked to answer that question impacts the final analysis and interpretation of the data. The branch of math called statistics deals with collecting and organizing data so that it can be analyzed.
One way to analyze data is by using a line plot. Line plots show the frequency of something by displaying the data on a number line. Line plots help show patterns in data, which helps you interpret that data. Not all of the data you work with will be whole numbers. Some of it will likely be fractions, which fall between whole numbers.
Example 1: Bakery
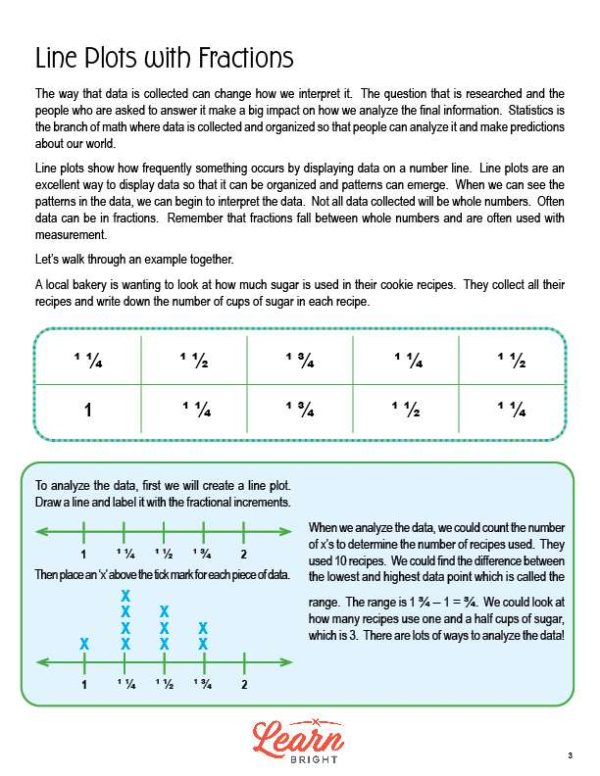
Let’s look at an example. A local bakery wants to look at how much sugar they use in their cookie recipes. They collect all their recipes and write down the number of cups of sugar in each recipe. In this example, the data set includes: 1 1/4, 1 1/2, 1 3/4, 1 1/4, 1 1/2, 1, 1 1/4, 1 3/4, 1 1/2, and 1 1/4.
To analyze this data, you first need to create a line plot. To do this, you draw a line and label it in fractional increments. Next, place an x above the tick mark for each piece of data.
Now that you have a line plot, you can analyze the data in a number of different ways. You could count the total number of x’s to determine how many recipes they used to collect the data. They used 10 recipes to collect this data. You could find the difference between the lowest and highest data point, also known as the range. The range is 1 3/4 – 1 = 3/4. You could also figure out how many recipes use one and a half cups of sugar, which is 3. There are lots of possibilities!
Example 2: Butterfly Collector
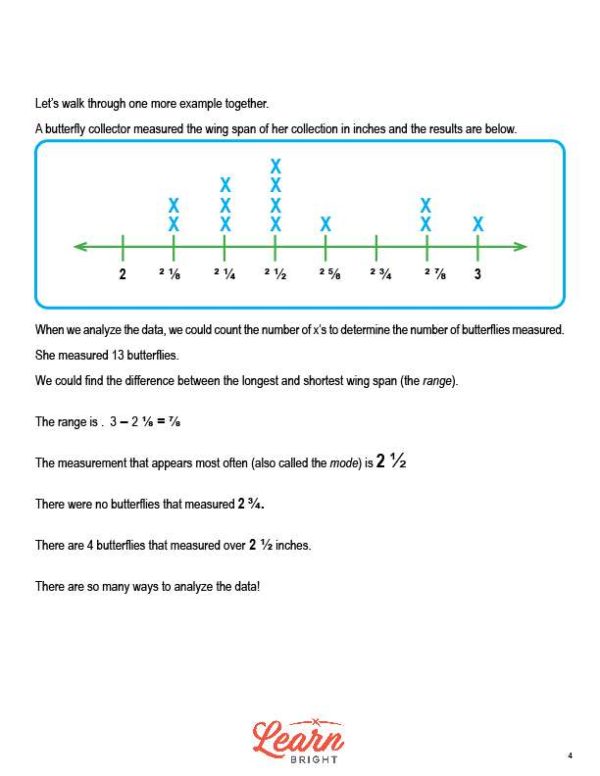
Let’s look at another example. A butterfly collector measured the wing span of her collection in inches. The results are shown in a line plot on the worksheet. Since you already have a lint plot, you can jump straight in to analyzing the data.
You could count the total number of x’s to determine the number of butterflies measured. When you do so, you can see that she measured 13 butterflies. You could find the difference between the longest and shortest wing span (the range). The range is 3 – 2 1/8 = 7/8. Next, you could find the measurement that appears most often (also called the mode), which is 2 1/2. Looking at the line plot, you can also see that no butterflies measured 2 3/4, but that there are 4 butterflies that measured over 2 1/2 inches.
You can learn so much by interpreting line plots!
REPRESENT AND INTERPRET DATA LESSON PLAN WORKSHEETS
The Represent and Interpret Data lesson plan includes three worksheets: an activity worksheet, a practice worksheet, and a homework assignment. You can refer to the guide on the classroom procedure page to determine when to hand out each worksheet.
MATH GAME ACTIVITY WORKSHEET
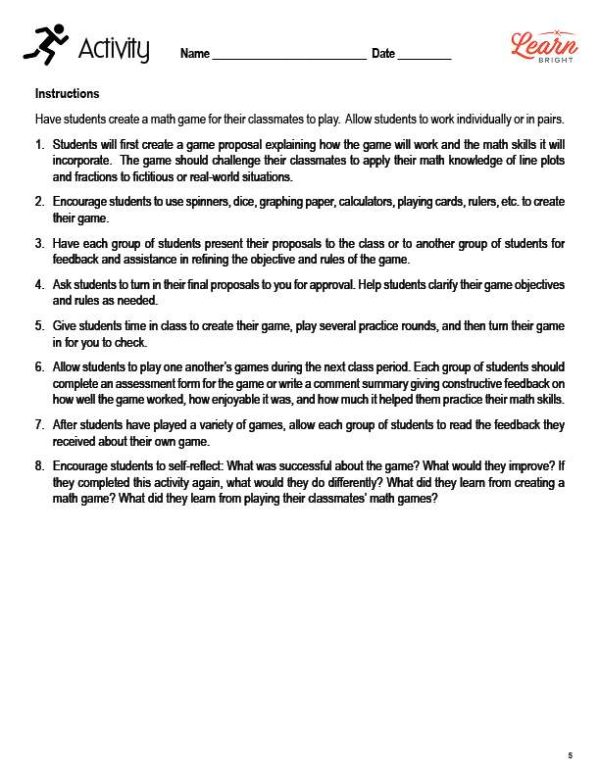
For the activity worksheet, students will create a math game for their classmates to play. To do so, students will first come up with a game proposal that explains how the game works and the math skills it incorporates. Each game should challenge the players to apply what they learned about line plots and fractions to fictitious or real-world situations.
Each student will then receive feedback on their proposal from another student. The teacher will provide final approval for each proposal. Once their proposals are approved, the students will create their game! Students will then play each other’s games during class. Finally, they will reflect on what was successful about their game and what could be improved.
LINE PLOT PRACTICE WORKSHEET
The practice worksheet asks students to create line plots for the data listed on the worksheet and answer questions about them.
REPRESENT AND INTERPRET DATA HOMEWORK ASSIGNMENT
For the homework assignment, students will collect data on the number of letters in the names of people they know. They will write the names and number of letters for each person in the chart on the worksheet. Next, they will draw a line plot showing this data on a separate piece of paper. Finally, they will answer questions about their line plot.
QUIZ
This lesson also includes a quiz that you can use to test students’ understanding of the lesson material. For the quiz, students will answer questions about a line plot.
Worksheet Answer Keys
This lesson plan includes answer keys for the practice worksheet and the quiz. If you choose to administer the lesson pages to your students via PDF, you will need to save a new file that omits these pages. Otherwise, you can simply print out the applicable pages and keep these as reference for yourself when grading assignments.